I am looking for: Learn arrow down
I am looking for:
Categories
Categories
Screw Threads and Fasteners

This document gives the student a text and graphic overview of screw threads and fasteners.
By Kelly Curran
Orthographic Projection #1
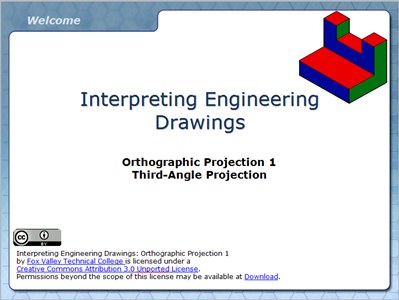
In this interactive and animated object, learners examine orthographic projection and the Glass Box Theory. Front, side, and top view development is demonstrated with pictorial views of each object to help develop 2D to 3D visualization skills.
Timing Diagrams (Screencast)
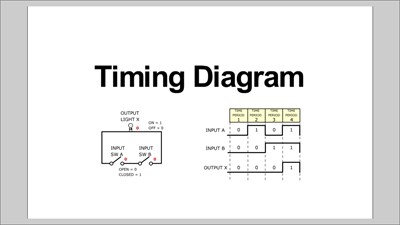
The explanation and use of timing diagrams used in digital electronics to graphically show the operation of various circuits are given.
Transistor Fundamentals: Classes of Operation

Students read about the three main classes of amplifiers and view graphical representations of the collector current and circuit.
The Coherence Principle

Explore how the coherence principle uses concise narration and graphics to illustrate good eLearning.
By Kris Wilson
The Contiguity Principle

Explore how aligning on-screen text and narration with graphics can help improve knowledge retention and learner engagement.
By Kris Wilson
What Is a Radian?

In this learning activity you'll explore a graphical depiction of a radian for angular measurement.
By Roy Peterson
Orthographic Sketching
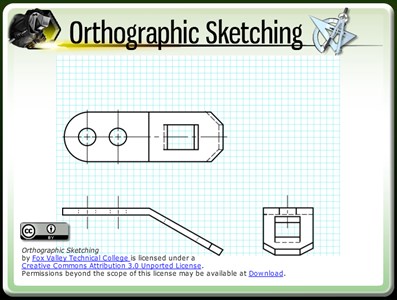
The learner will understand how to view an object for interpretation in the standard orthographic format and then accurately sketch three orthographic views using 3rd angle projection.
By Jessie Lloyd
Complex Numbers: So What's All the Fuss About?
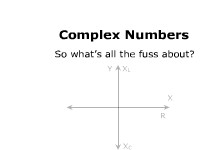
Learners explore the use of complex numbers through a series AC circuit analysis problem. The steps are compared to the graphical method of finding circuit impedance and the phase angle.
Transactional Communication Model (Graphic)
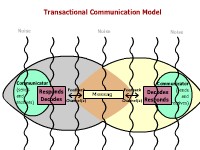
In this learning activity you'll view a graphical layout of the transactional communication model.
Safety - Hydraulic Metal Shears

The learner reads about safety considerations for operating a hydraulic metal shear. Text, graphics and a brief assessment are included.
By Dave Hoffman
Motor Loading

Students view a graphical explanation of how the motor condition (unloaded, 50 percent loaded, fully loaded) affects the phase between voltage and current, the current draw from the AC supply, the amount of power consumed, and the power factor.
The Function Generator
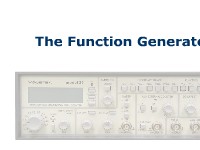
Students read a description of the function generator and view a graphic that labels its parts.
Statics: Resultant Calculations via Graphical Method
In this interactive learning object, students calculate a resultant of multiple forces acting in a concurrent, coplanar condition.
The Sine Wave
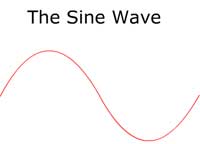
Using text and graphics, this learning activity describes a sine wave, including alternations, cycles, time, amplitude, and degrees
Boolean Theorems (Multivariable)

Students read the multivariable theorems and view the graphic depictions of the Boolean expressions.
Graphical BJT/JFET Transistor Biasing
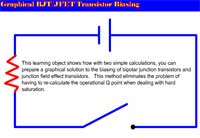
Learners use two calculations to prepare a graphical solution to the biasing of bipolar junction transistors and junction field effect transistors. This method eliminates the problem of having to re-calculate the operational Q point when dealing with hard saturation.
By Roger Brown
Ideal Filters

Students read about the ideal versions of the four common filters (low-pass, high-pass, bandpass, and notch), and view graphical representations of the filters' frequency characteristics.
Creating Appropriate Graphics - Memo or Fax
In this learning activity you'll interpret phone messages to create a fax or a memo.
Summary of Energy Yield During Cellular Respiration

Learners review a graphic summary of the three series of reactions that occur during cellular respiration and the net energy (ATP) yield of that process.