I am looking for: Learn arrow down
I am looking for:
Categories
Categories
Orthographic Projection #1
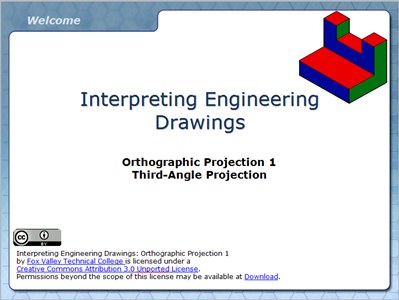
In this interactive and animated object, learners examine orthographic projection and the Glass Box Theory. Front, side, and top view development is demonstrated with pictorial views of each object to help develop 2D to 3D visualization skills.
Introduction to Records Management: Types of Records
In this interactive object, learners read an overview of records management and then classify records as "vital," "important," "useful," or "nonessential" in a drag-and-drop exercise.
By Kim Olson
Value Stream Mapping: Drawing a Current-State Map
Learners follow step-by-step instructions for creating a current-state map to identify how materials and information flow.
By Kaye Krueger
Orthographic Sketching
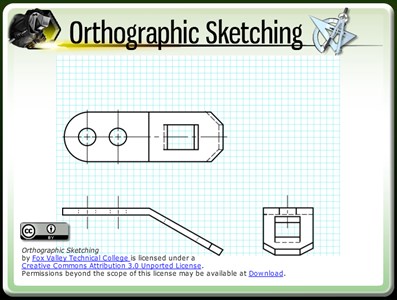
The learner will understand how to view an object for interpretation in the standard orthographic format and then accurately sketch three orthographic views using 3rd angle projection.
By Jessie Lloyd
Print Reading: Step Block
In this animated print reading exercise, the learner calculates missing dimensions and identifies surfaces on projected views.
By Kelly Curran
Business Records Management
In this interactive lesson, learners read the rules for filing business records and then test their knowledge in a series of exercises. Immediate feedback is provided.
IT Stress Management - Time Management
In this learning activity you'll explore what time management is, some general techniques for improving your time management skills, and the Pomodoro Method.
By mikhailvmatc
Records Management: An Introduction to Filing Rules and Indexing (Screencast)
In this screencast, learners read an explanation of the file rules and indexing that have been developed by the Association of Records Managers and Administrators.
By Kim Olson
What is Supply Chain Management?
In this learning activity, you will learn what supply chain management is, four main links that make up the supply chain, and explore examples of how effective supply chain management works.
Goal Setting: Business, Personal, and Family Goals

In the first section of this activity, learners listen to an introduction explaining the importance of setting goals in all aspects of life. The remaining pages list examples of goals and procedures relating to a farming operation.
Records Management: Applying ARMA Rules to Business Filing

In this interactive object, learners apply their knowledge of the Association of Records Managers and Administrators (ARMA) filing rules by organizing and filing records alphabetically, numerically, and by subject.
By Kim Olson
Six Sigma Process Performance Analysis
Students examine examples for calculation yield, throughput yield, rolled throughput yield, and payback, each of which is used to analyze process performance in a Six Sigma project.
By Lee Binz
Pharmacologic Management of Diabetes Mellitus (Screencast)
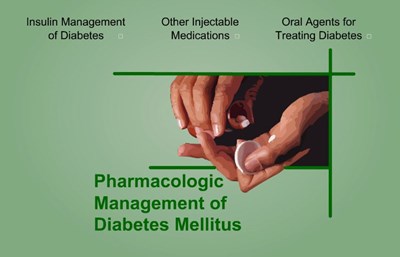
In this screencast, learners examine the action of insulin and other antidiabetic medications.
By Kathleen Lee
Personal Savings/Spending Plan for Adults - Projected
In this learning activity you'll complete your own budget to understand the concept of needs and wants relating to building a personal budget.
Value/Supply Chain Management
In this animated object, learners examine how to establish an effective supply chain that builds customer loyalty.
By Weldon Faull
An Overview of the Raspberry Pi

In this learning activity you'll discover what the Raspberry Pi is, how it's used, and some projects you can do at home.
BLEED: How to Extend an Image Past the Edges of a Printing Project

Learners follow design steps incorporating a bleed, a technique used to allow for inaccuracies in the printing and trimming processes.
By Dan Seanor
Lathe Project: Turning Between Centers
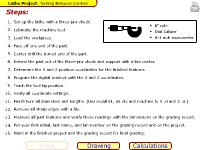
Learners read work instructions and view a drawing for turning between centers on a lathe.
IT Stress Management - Root Cause
In this learning activity you'll explore how finding and understanding the root cause of stressors can help reduce stress in your life.
By mikhailvmatc
Supply Chain Management
This interactive activity represents the grid modeling technique, a heuristic model for choosing a centralized location for a manufacturing or distribution center within a supply chain network. The formula calculates a central point between the suppliers and the markets. This object requires the latest version of Flash Player.